Hello.

Thank you for taking a minute to get to know me.

My love of programming was discovered by accident while trying to write a rather lengthy if/then formula in Excel. At the time, I was nearing my tenth year as a Business Analyst, a career which had yet to prove itself to be entirely fulfilling. Initially, I tried to focus on the more immediate and practical applications of programming which, at that time, were SQL and a bit of VBA, as they helped automate simple tasks in my daily work.

From there, I began consuming every online resource I could get my hands on, but they lacked the balanced curriculum that I knew I needed if I wanted to pursue programming as a career.

This summer, I completed an in-person Full-Stack JavaScript course that allowed me to continue to explore my passion for programming. Additionally, this course offered workshops focused on Agile, testing, UI/UX, and design which I became equally passionate about.

When testing, I enjoy the procedural, logic-based approach that is required to detect and diagnose defects. Having worked in a Waterfall environment before, Agile's focus on quick iteration and empirical feedback are a welcome and long overdue change for me. UI and UX speak to my creative side, as as I love the challenge associated with creating something that is both useful and beautiful.

My degree in marketing instilled in me a curiosity about how to create products that can meet a customer's needs. In my work as a Business Analyst, I became accustomed to answering questions, gathering requirements, and communicating effectively across an organization. Through programming, I have uncovered a way to incorporate my professional experience and personal interests in a way I could have never imagined, and it's with this enthusiasm that I look forward to each new day.

Comfort Zones

I have worked across a wide range of frameworks and programs. Here's a sampling of the areas I know best.

  • HTML, CSS, JavaScript
  • Bootstrap, Angular, Blaze/Spacebars, Polymer, Stylus
  • Meteor and Node
  • NoSQL and SQL databases
  • Heroku and Nitrous Deployments
  • Github, Slack, Confluence, SharePoint
  • Excel, Access, Power BI, Tableau
  • Agile and Six Sigma methodologies

Accomplishments & Projects

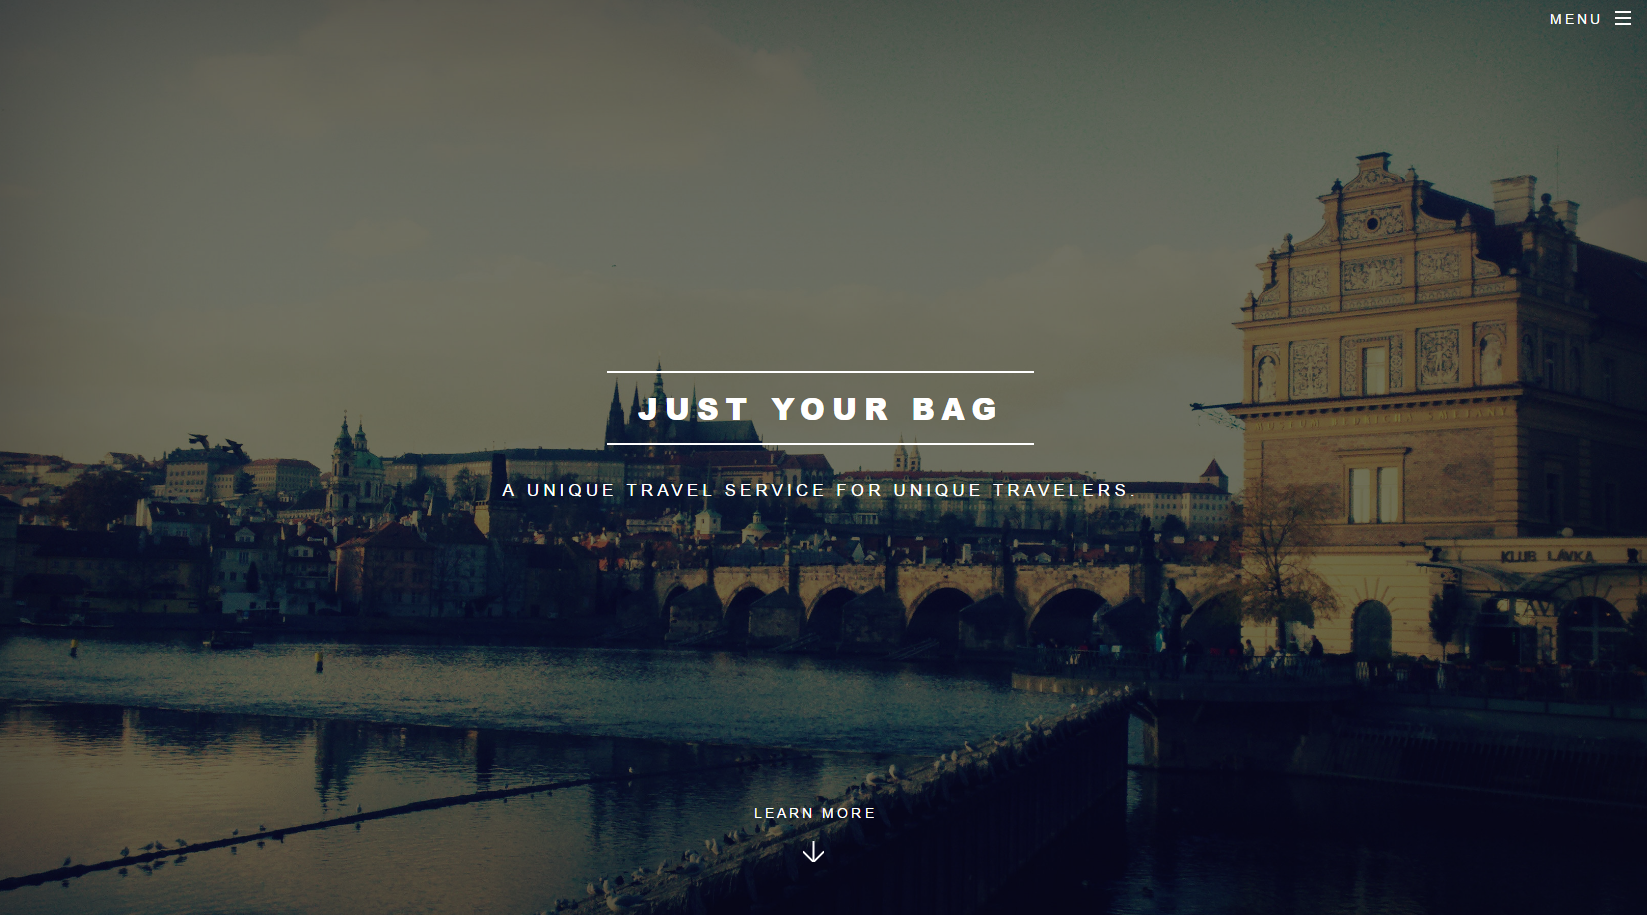
just your bag app picture

Just Your Bag

Just Your Bag is a travel planning service designed to reduce the stress around trip planning and provide travelers with unique experiences and destinations. This particular project is especially exciting to me as it's enabled me to explore a variety of tasks related to product and business development.

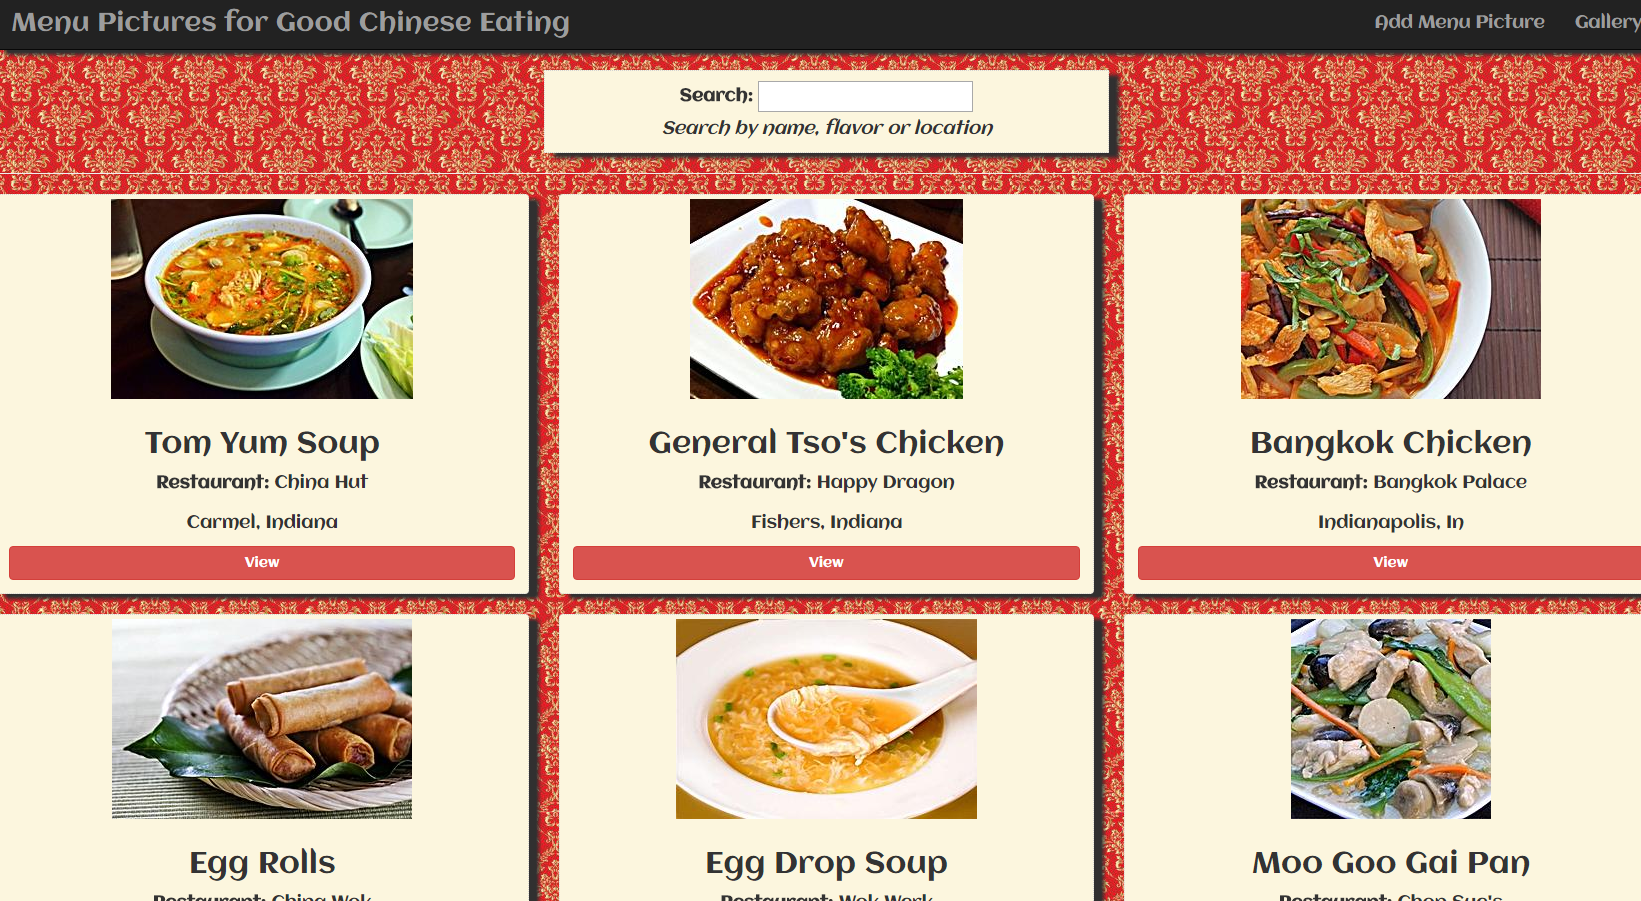
chinese food app

Chinese Menu Item Pictures

I don't know about your local Chinese restaurant but every one I've been to has the exact same 10 pictures on display, and I know not one of them features their actual food. So, I built this app in hopes to source actual pictures from real-life customers with the idea that if I can see enough delicious alternatives to General Tso's Chicken, I just might decide to try something new. This MEAN app uses mLab and Filestack to save and serve my data.

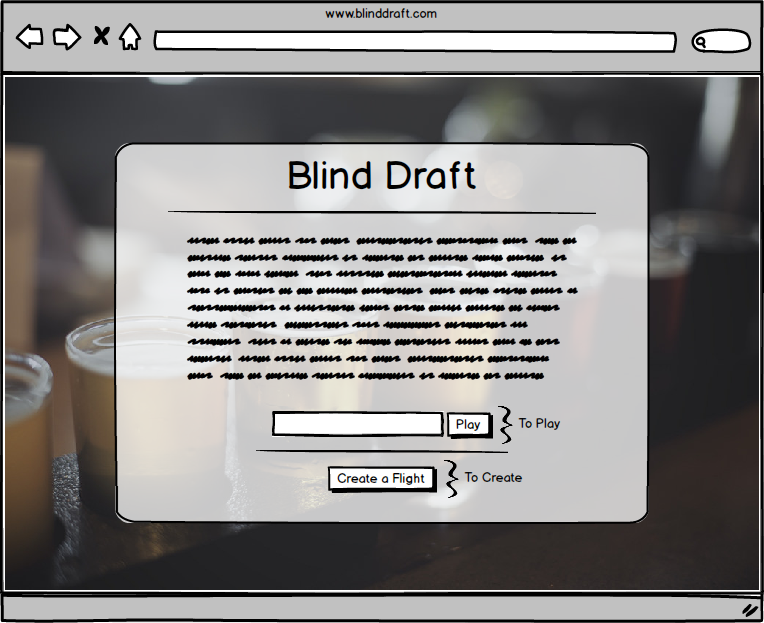
Blind Draft home screen mockup

Blind Draft (Wireframe)

A balsamiq mockup for a social party game where players are challenged to identify and sort beverages based on a randomly ordered list provided to them. Click the image to the left to link to my balsamiq workspace.

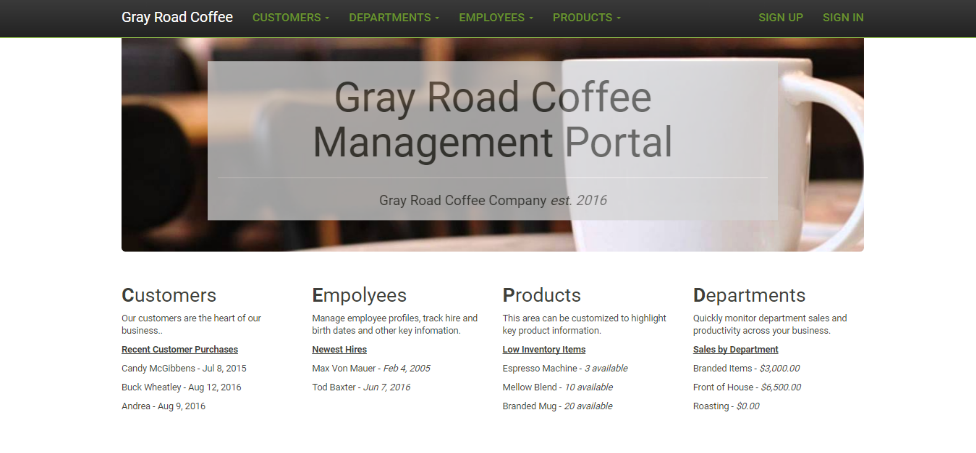
management portal for gray road coffee

Gray Road Coffee Management Portal

This is a MVP for a fictional coffee shop's management portal. Using the MEAN stack, this site allows management to track employee, customer, and product data and features customizable summary lists on the main page. The portal is currently not deployed.

The Barfly Papers banner with an inkspot and a fly on it

The Barfly Papers

A Wordpress blog aimed at documenting unique experiences and locations from across the world. Now that I have the skill set, I will be rebuilding it using Angular.

sample of excel report

Data Dashboards and Analysis

My years as a Business Analyst and my marketing degree have given me the ability to understand business at all levels and through a variety of stakeholder lenses. Often, the best way to communicate my findings and analysis was through the use of reports and dashboards. Here's an example of reporting done in Excel, the objective of which was to provide a high-level analysis of student achievement.

Let's Connect